Reviving Jetson Nano to run some LLMs
Large Language Models – minus the Large – on a tiny Jetson Nano.
· 10 min read
Seven years ago I bought a Jetson Nano 2GB for $70. I ran some graphics and computer vision examples, but I mostly used it as a multimedia server (I used to watch YouTube and films on an Xbox 360, so it was a less weird alternative).
Today is some day in December 2025, and I want to bring this beast, with a whopping 128 CUDA cores, back to life and see whether it can survive “The Trial of the LLMs”.
Setup #
First of all, we need to get Linux running on the machine. The microSD card I bought with the Jetson was used for my DSLR, so let’s build an image from scratch.
I still remember that the official NVIDIA images are a pain; fortunately, we are blessed with a better (and lighter!) alternative: pythops/jetson-image.
I've hidden the commands so they don't take up so much space, but providing them is essential because some of them are not trivial.
After setup, we can
git clone https://github.com/pythops/jetson-image
cd jetson-image
and make a rootfs with a five-major-versions-old Ubuntu
just build-jetson-rootfs 20.04
Build the image for our board
just build-jetson-image -b jetson-nano-2gb -l 32
Copy the image back to the host
multipass transfer builder:/home/ubuntu/jetson-image/jetson.img .
and finally flash the image onto the board
sudo dd if=jetson.img of=/dev/diskN bs=1m
Setting up WiFi
Logging in #
After typing the login jetson and password jetson, we’re in!
Running free -m shows a total of ~1700 MB of 64-bit LPDDR4 to spare. That’s CPU RAM and GPU VRAM combined, so we’ll try to use as much of it as possible.
Obviously, beefy engines like vLLM or sglang are out of the question, so we have to resort to llama.cpp. We could write something from scratch using minimal overhead like llama.c, but I want to run modern LLMs and not debug C/C++/Rust code. Oh no, that’s exactly what I ended up doing.
Here is the first pitfall: llama.cpp doesn’t provide a linux-cuda-arm64-smth binary, so building it from source is the only option.
Some madlad already did this, but they had the 4GB version, it will be interesting to see speed difference.
Benchmarking #
I thought that just running couple of prompts is too simple, so inspired by LLM’s Engineer Almanac by Modal I’ve decided to write my own benchmarking tool.
Original code modal-labs/stopwatch runs on Modal and tested vLLM, SGLang, and TensorRT-LLM.
My version wtfnukee/hourglass is smaller (and focused on edge devices), hence the name.
Hourglass #
Hourglass is a Rust-based CLI tool specifically designed for benchmarking LLMs on edge devices. Unlike cloud-focused benchmarks, it’s optimized for resource-constrained devices with thermal throttling, limited memory, and shared CPU/GPU memory architectures.
Key Features:
- Multi-Backend Support: CPU, CUDA (Jetson/x86), Metal (Apple Silicon), and Vulkan
- Comprehensive Metrics: TTFT, ITL, TTLT, throughput, system resource usage
- Edge Device Focus: Optimized for devices like Jetson Nano, Raspberry Pi
- System Monitoring: Tracks CPU/GPU usage, memory, temperature, and power consumption
- Structured Output: JSON output for easy analysis and visualization
Our test subject is Qwen/Qwen2.5-{size}-Instruct, 3 model sizes (only 0.5B, 1.5B, 3B dense models) in 8 quantizations (q2_k, q3_k_m, q4_0, q4_k_m, q5_0, q5_k_m, q6_k and q8_0). Following Almanac we’ll measure TTFT, ITL, TTLT and throughput on sequences below:
| in tokens | out tokens | scenario |
|---|---|---|
| 128 | 1024 | chat |
| 256 | 2048 | long response |
| 512 | 512 | balanced |
| 512 | 4096 | generation heavy |
| 1024 | 128 | completion |
| 1024 | 1024 | standard chat |
| 2048 | 256 | RAG style |
| 2048 | 2048 | long context |
| 4096 | 512 | context heavy |
Instruct version was chosen because it handles instructions better and talks more like a human – which helps when you’re benchmarking alone at 2 a.m. and need emotional support from an AI girlfriend running at 0.3 tokens/s.
Understanding Bottleneck #
Before diving into results, let’s understand what limits the Jetson Nano. Here are the key specs:
Hardware:
- CPU: 4$\times$ ARM Cortex-A57 @ 1.43 GHz
- GPU: 128 CUDA cores (Maxwell) @ 921 MHz max
- Memory: 2GB LPDDR4 @ 1600 MHz
- Memory bandwidth: 25.6 GB/s (shared between CPU and GPU)
- Storage: Samsung EVO Plus 64GB microSD (~130 MB/s read, ~10 MB/s write)
People are mocking $4000 DGX Spark for 273GB/s of memory bandwidth, but how do you like tenth of that?
LLM inference has two phases:
- Prefill (prompt processing): Memory-bound. Loading model weights dominates.
- Decode (token generation): Compute-bound. Matrix multiplications on small batches. (Assuming KV cache. Please do.)
For a model like Qwen2.5-0.5B in Q4 quantization (~408 MB), let’s calculate the rooflines:
Prefill arithmetic intensity:
- Must load entire weight matrix: ~408 MB (Q4_0)
- For 512 tokens: 411 $\times$ 2 $\times$ 0.5B params ≈ 411 GFLOP
- Processing in 1 batch (512 batch size): load model once
- Arithmetic intensity: 411 GFLOP / 408 MB ≈ 1,007 FLOP/byte
Theoretical peak (memory-bound):
- Memory bandwidth: 25.6 GB/s
- Peak prefill: 25.6 GB/s $\times$ 1,007 FLOP/byte ≈ 25.8 TFLOPS
But the GPU’s actual compute: 128 cores $\times$ 921 MHz $\times$ 2 (FMA) ≈ 0.236 TFLOPS
Prefill is memory-bound (25.8 TFLOPS $\gg$ 0.236 TFLOPS). We’re bandwidth-starved. Bandwidth-fucked, dare I say.
Observed: 115.89 tokens/s
Prefill: 411 tokens in 3.55s = 115.89 t/s
Throughput: 115.89 t/s $\times$ 1 GFLOP/token $\approx$ 115.89 GFLOPS
Bandwidth used: 408 MB / 3.55s = 115 MB/s
Efficiency: 115.89 / 25,800 = 0.45% of theoretical peak
Still only 0.45% efficiency, but 4× faster than CPU (115.89 vs 28.87 t/s).
Also: The model lives on a microSD card. If we exceed 2GB memory and start swapping, we’re reading weights at 10-130 MB/s instead of 25.6 GB/s. That’s a 200-2500× slowdown. Jetson used swap extensively for big models and it was miserable.
Decode arithmetic intensity:
- Generate 1 token: $\sim$193M FLOPs (24 layers $\times$ 8M FLOPs/layer)
- Must load weights: $\sim$408 MB (assuming no caching)
- With 50% cache hit: $\sim$204 MB per token
- Arithmetic intensity: 193M FLOPs / 204 MB $\approx$ 0.95 FLOP/byte
Theoretical peak (memory-bound):
- Memory bandwidth: 25.6 GB/s
- Peak decode: 25.6 GB/s $\times$ 0.95 FLOP/byte $\approx$ 24.3 GFLOPS
- GPU compute limit: 236 GFLOPS
Decode is memory-bound (24.3 GFLOPS $\ll$ 236 GFLOPS).
Observed: 8.0 tokens/s
Decode: 511 tokens in 63.8s = 8.0 t/s
Throughput: 8.0 t/s $\times$ 193M FLOP/token = 1.54 GFLOPS
Efficiency: 1.54 / 24.3 = 6.3% of bandwidth
Only 6.3% efficiency, but typical for single-batch inference on edge devices. GPU is slightly faster than CPU (8.0 vs 7.43 t/s) but not dramatically - both are memory-bound.
CPU #
Well, the Nano says hello… eventually.
Loading times are rough: the lightest model (0.5B q2) needs almost 7 seconds, while the heaviest (1.5B q5) takes around 32 seconds.
Token generation speed is actually fine, ranging from 8 -> 2.5 tok/s for same models. However, the TTFT is so high that using the CPU backend for any latency-sensitive scenario (like interactive chat) becomes impractical. If all you need is simple batch inference or occasional scripted calls, it works - but anything resembling real-time responsiveness is out of reach.
GPU #
Compiling CUDA version
Even the smallest model in q8_0 cannot fully fit on the GPU — the best configuration I managed was 24/25 layers on GPU and 1 on CPU, which introduces a small but noticeable cross-device penalty. However, once loaded, things look much better. TTFT drops massively, down to 1.2-3 seconds, making the GPU path dramatically more usable for interactive workloads. While the sustained generation speed is roughly similar to the CPU (still around 8 -> ~2.5 tok/s depending on the model), prefill performance sees ~7× improvement, which is exactly where GPU acceleration matters most for LLMs.
Bonus: Macbook Air M3 #
Just for fun, I also ran the same tiny models on a MacBook Air M3. Apple’s inference efficiency continues to be ridiculous:
0.5B q2_k — results/m3/0.5b-q2_k.json
prompt_eval_tps: 158,633.26
eval_tps:        1,186.81
3B q8_0 — results/m3/3b-q8_0.json
prompt_eval_tps: 162,720.99
eval_tps:          524.94
The M3 absolutely obliterates both CPU and GPU results on the Nano, especially in the prompt_eval phase. Even the 3B model runs with surprisingly high throughput for a fanless ultraportable. Apple’s unified memory + optimized Metal kernels continue to make small and mid-sized models feel effortless.
Performance Visualizations #
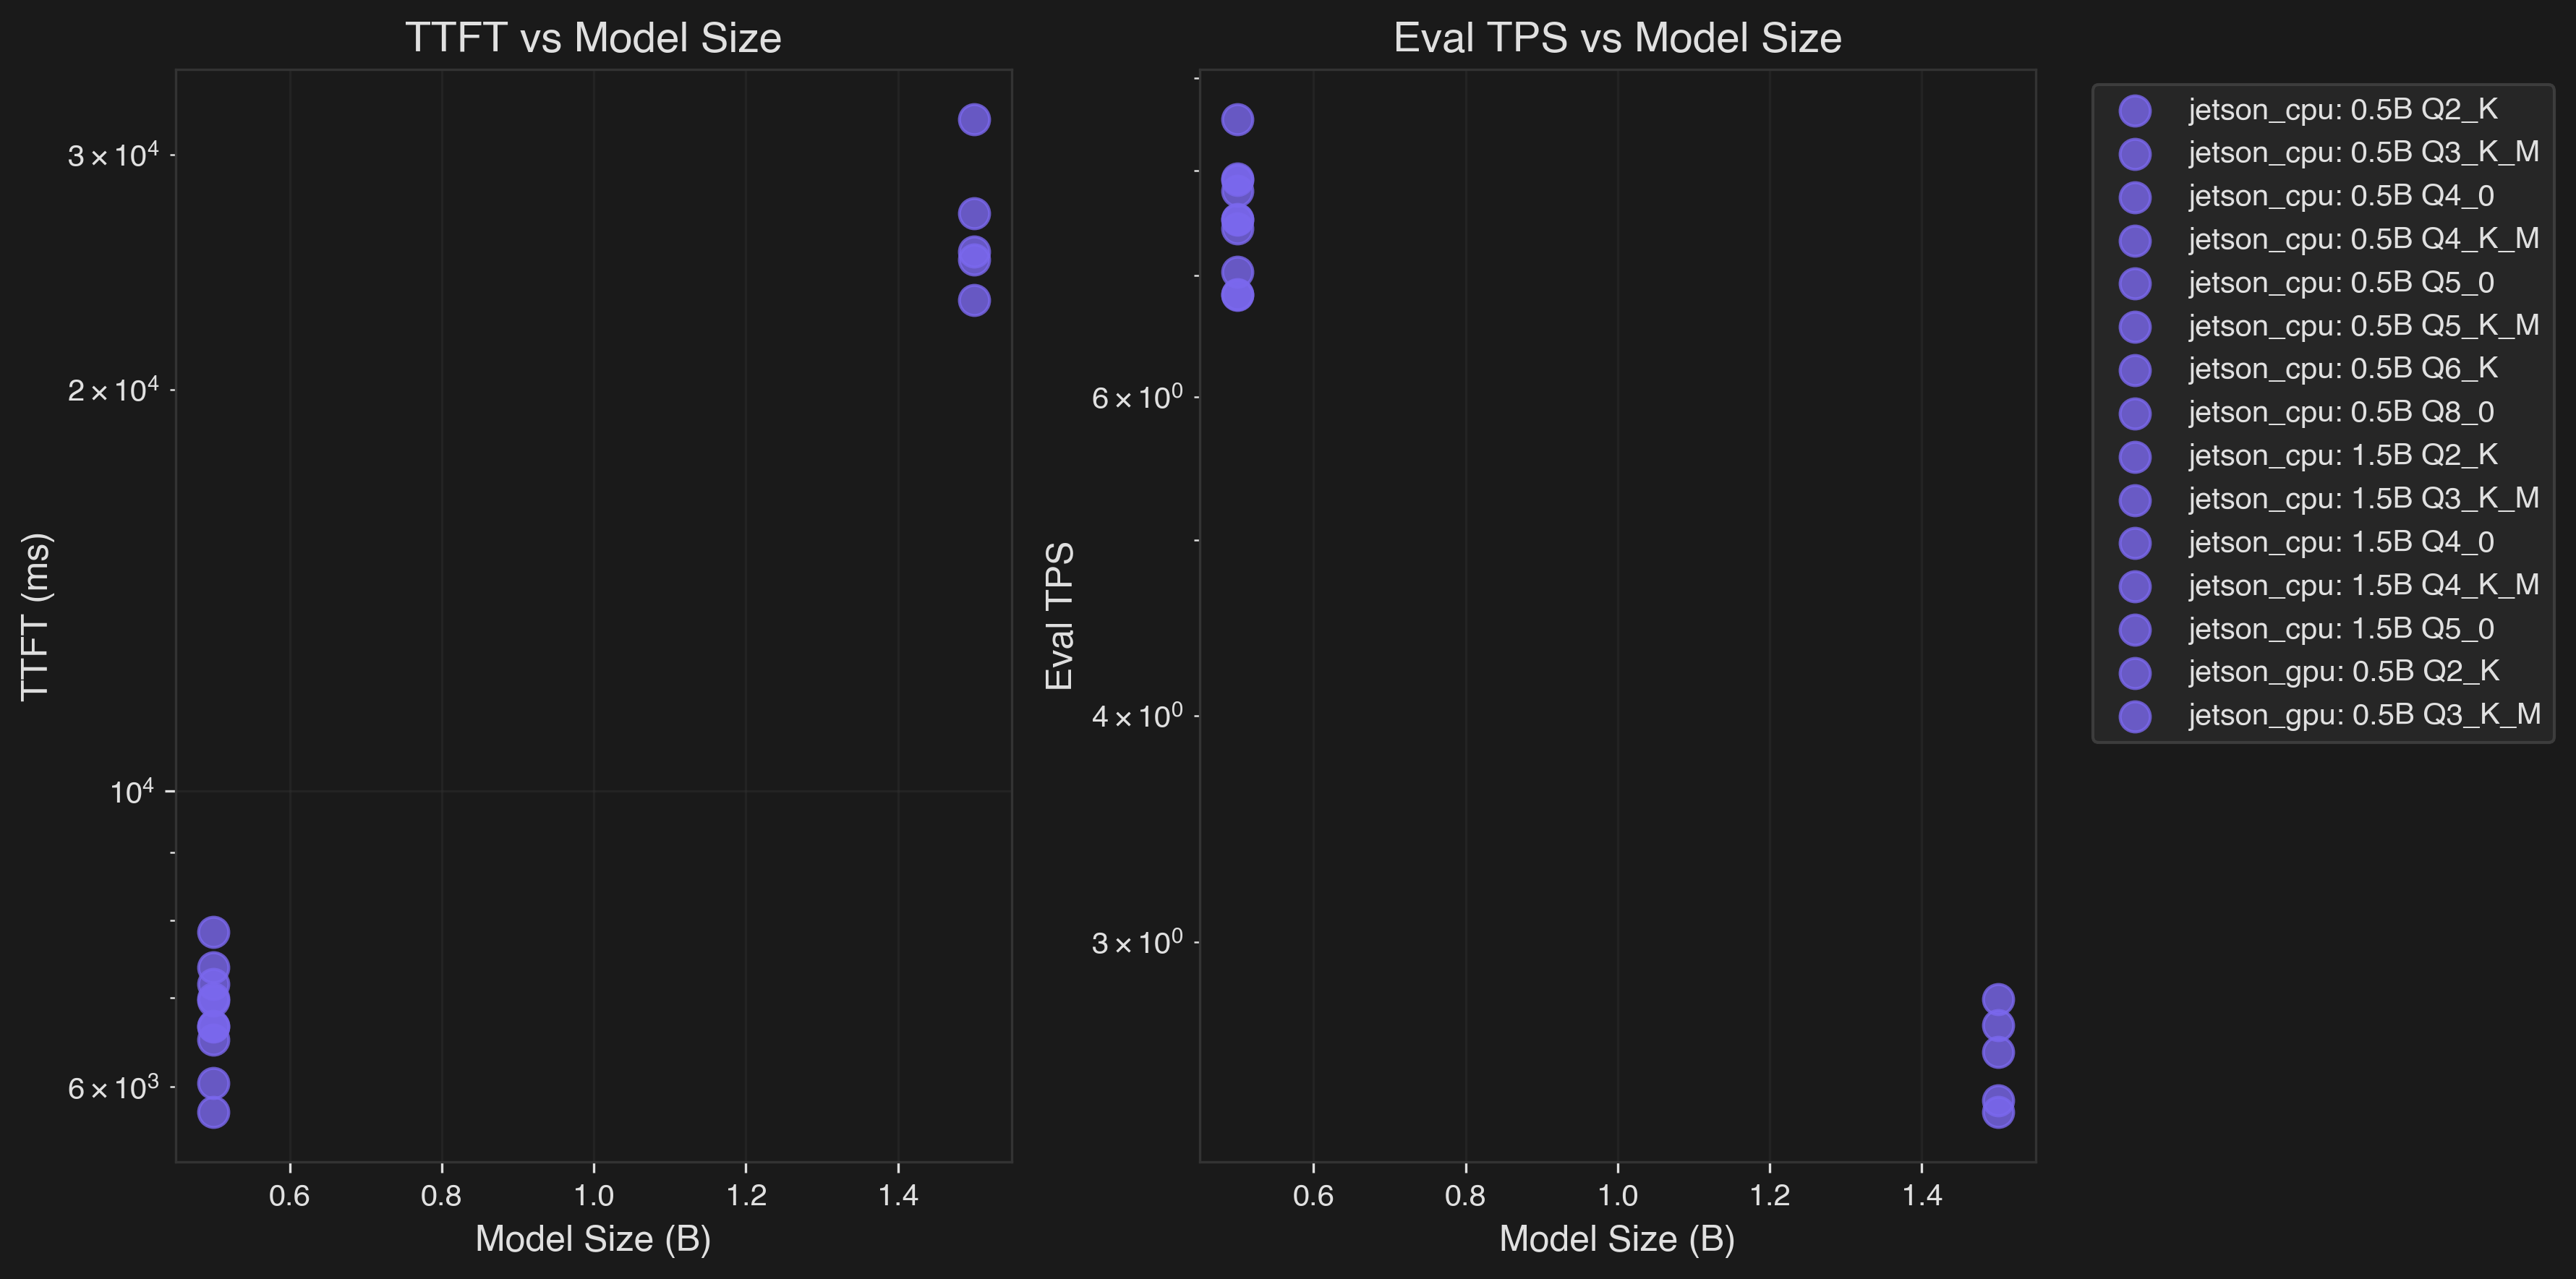
Left: TTFT vs Model Size | Right: Eval TPS vs Model Size
This chart shows how performance degrades as model size increases across Jetson CPU (purple) and GPU (blue) backends. The GPU shows significant advantages for larger quantizations (Q4_0+), while smaller quantizations (Q2_K) show minimal GPU benefit.
Platform Comparison #
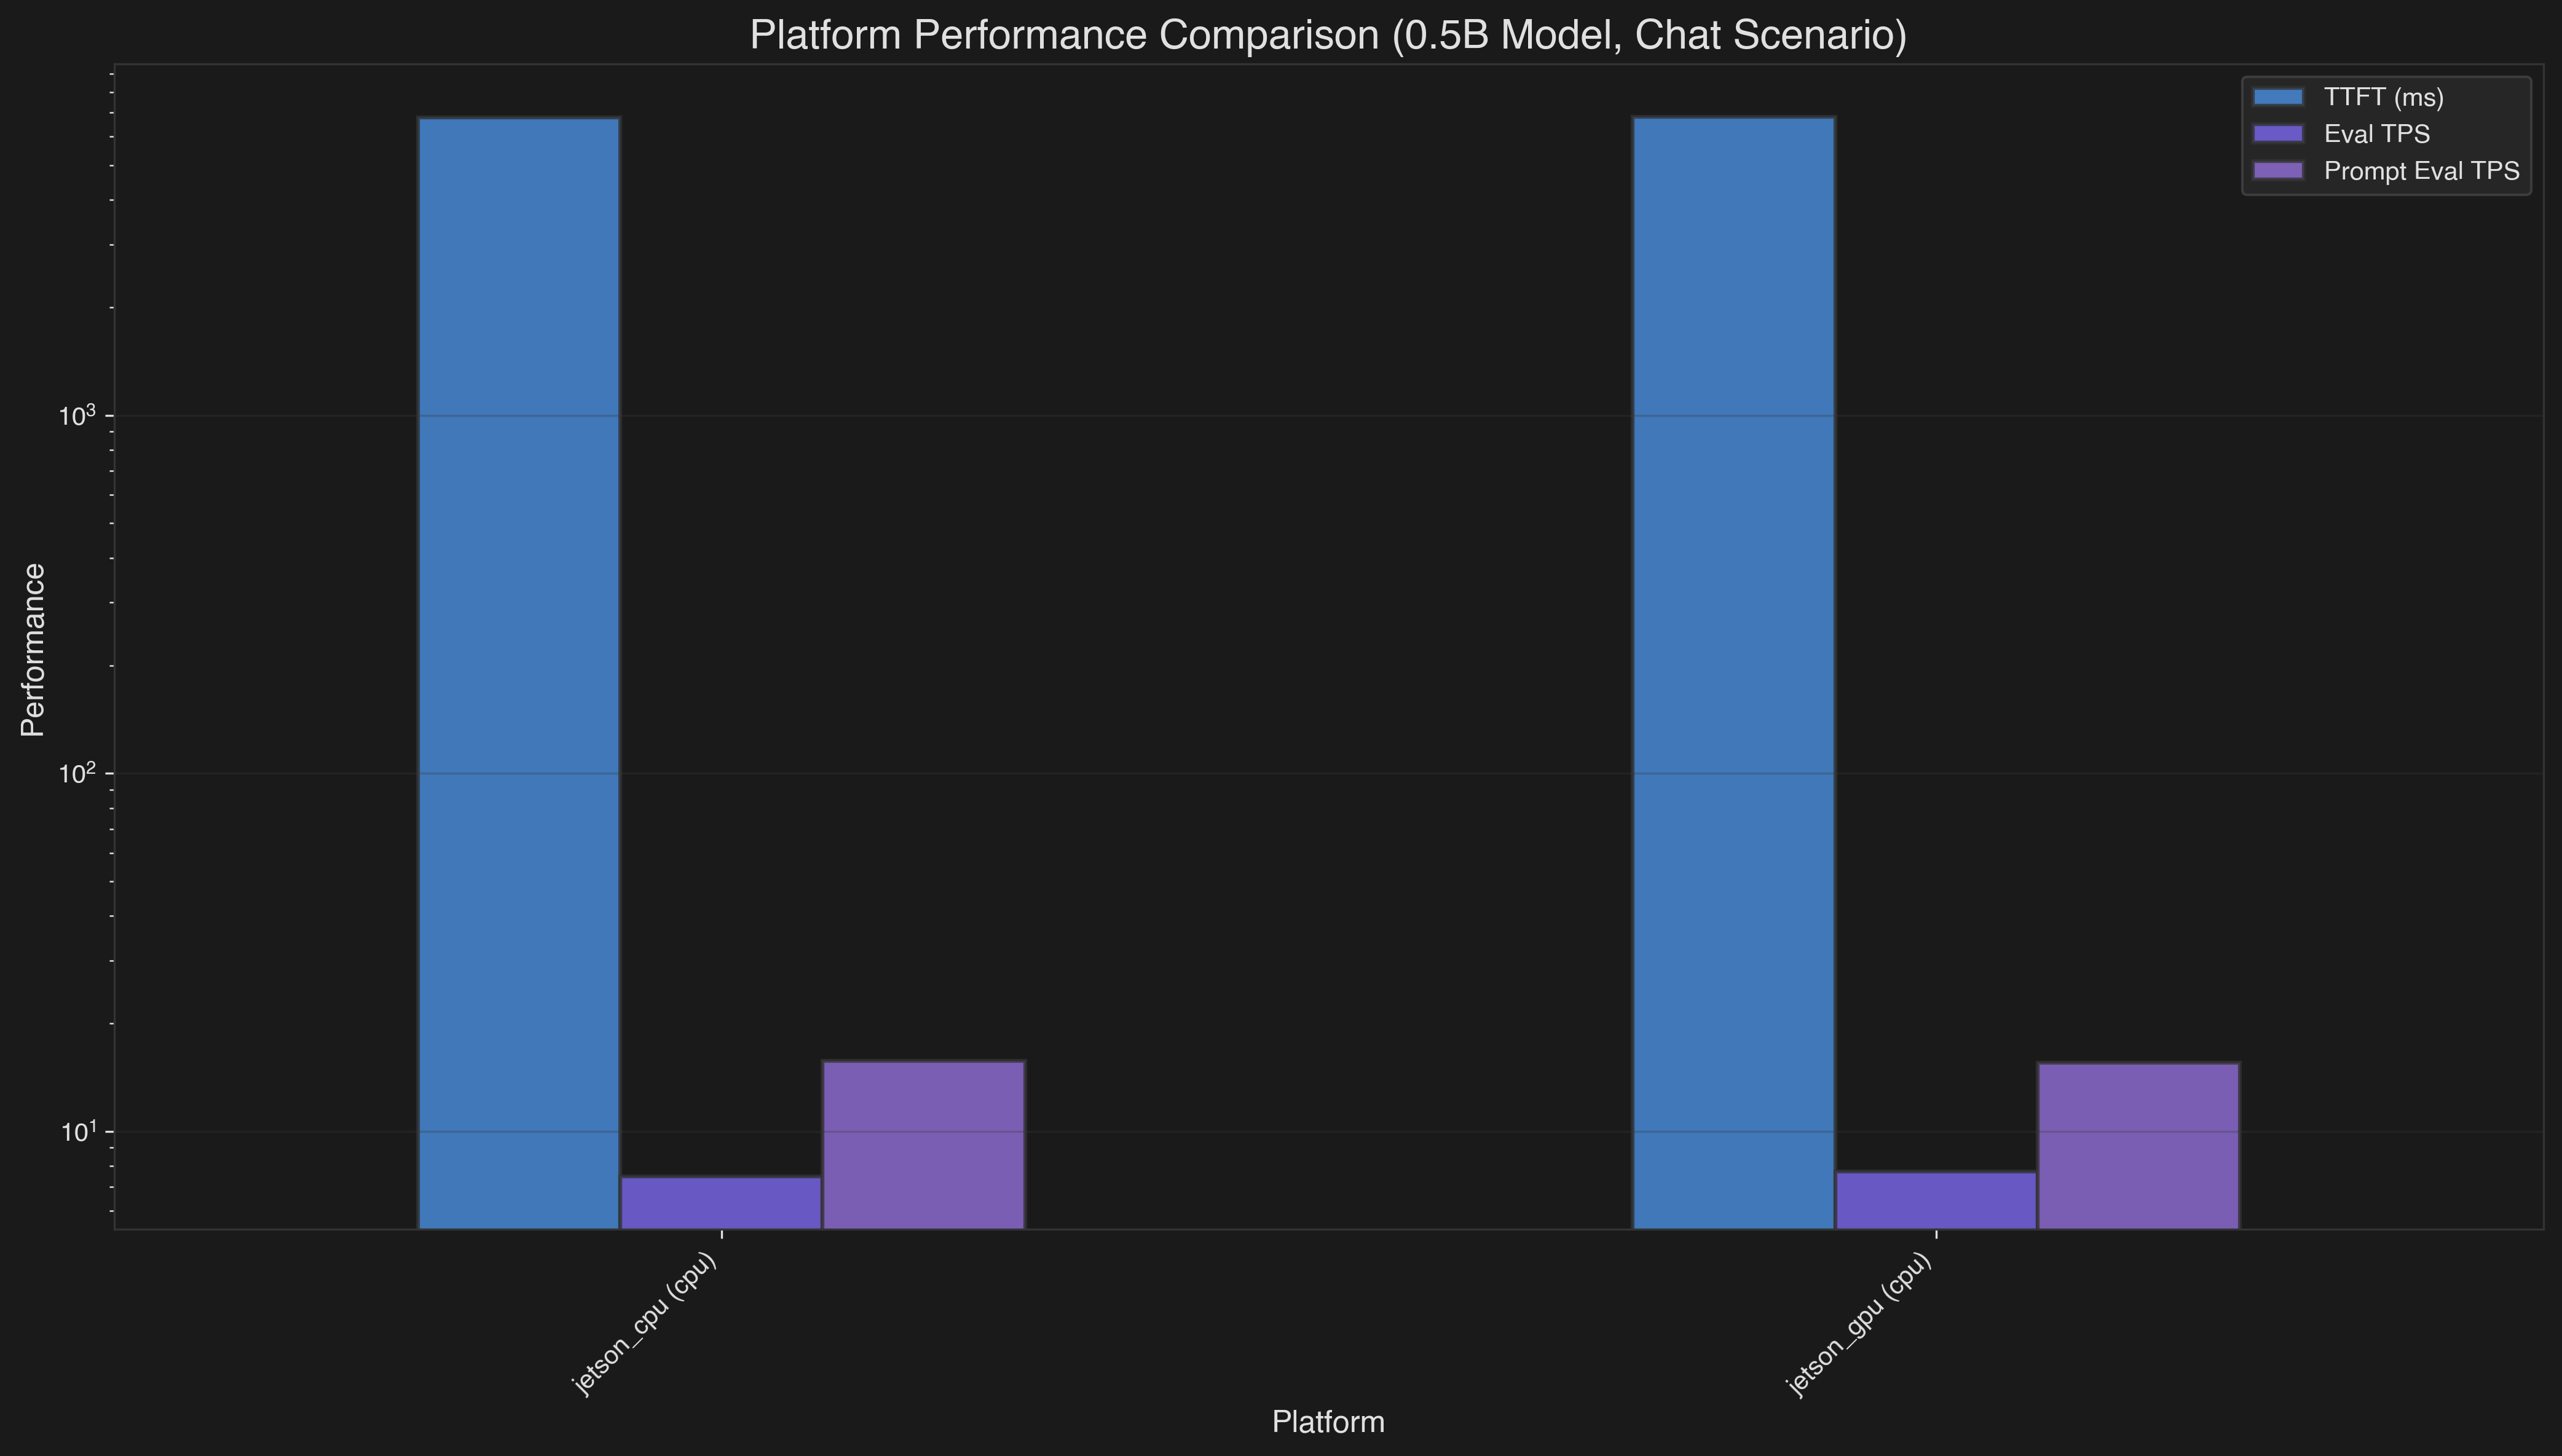
This bar chart compares Jetson CPU vs GPU performance across key metrics:
- TTFT (Time to First Token): GPU is ~5-6× faster than CPU for optimal quantizations (Q4_0/Q5_0)
- Eval TPS (Sustained Generation): GPU shows modest improvements in sustained token generation
- Prompt Eval TPS: GPU demonstrates ~80× improvement over CPU in prompt processing due to memory bandwidth advantages
Quantization Efficiency #
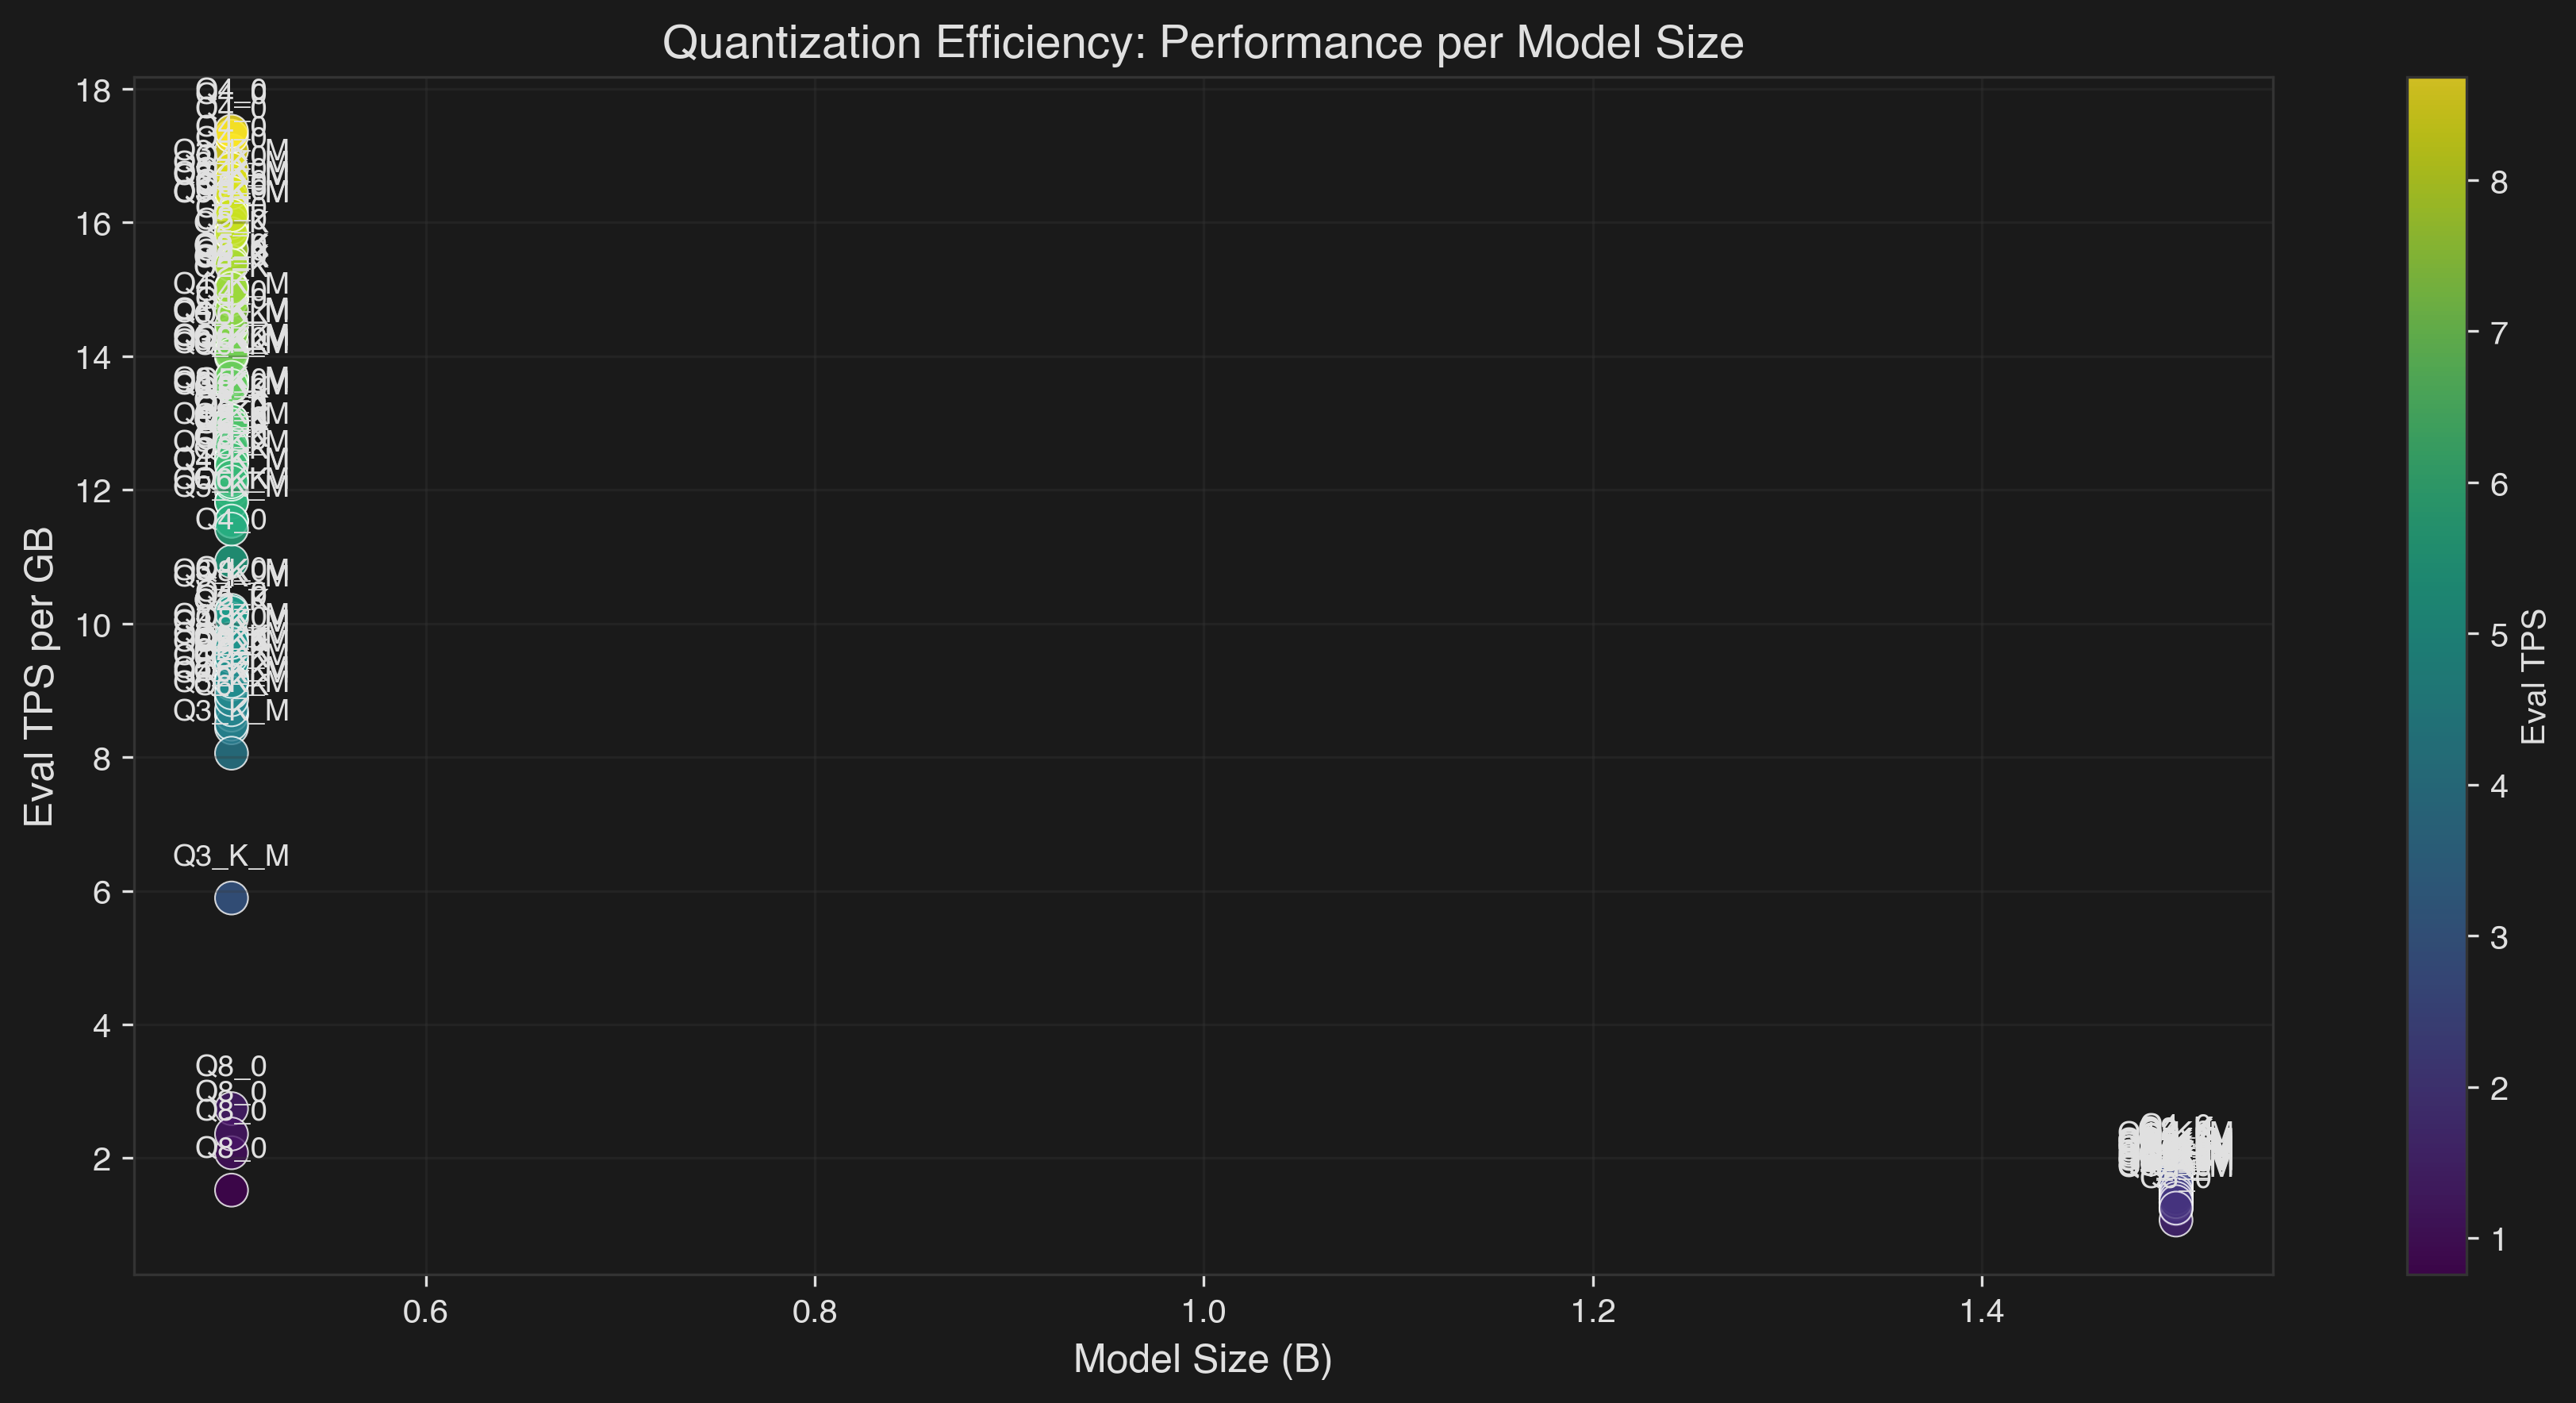
- Q2_K provides the best performance per GB for CPU
- Q4_0/Q5_0 show better GPU utilization despite larger size
- Color intensity represents absolute Eval TPS performance
Inter-Token Latency Distribution #
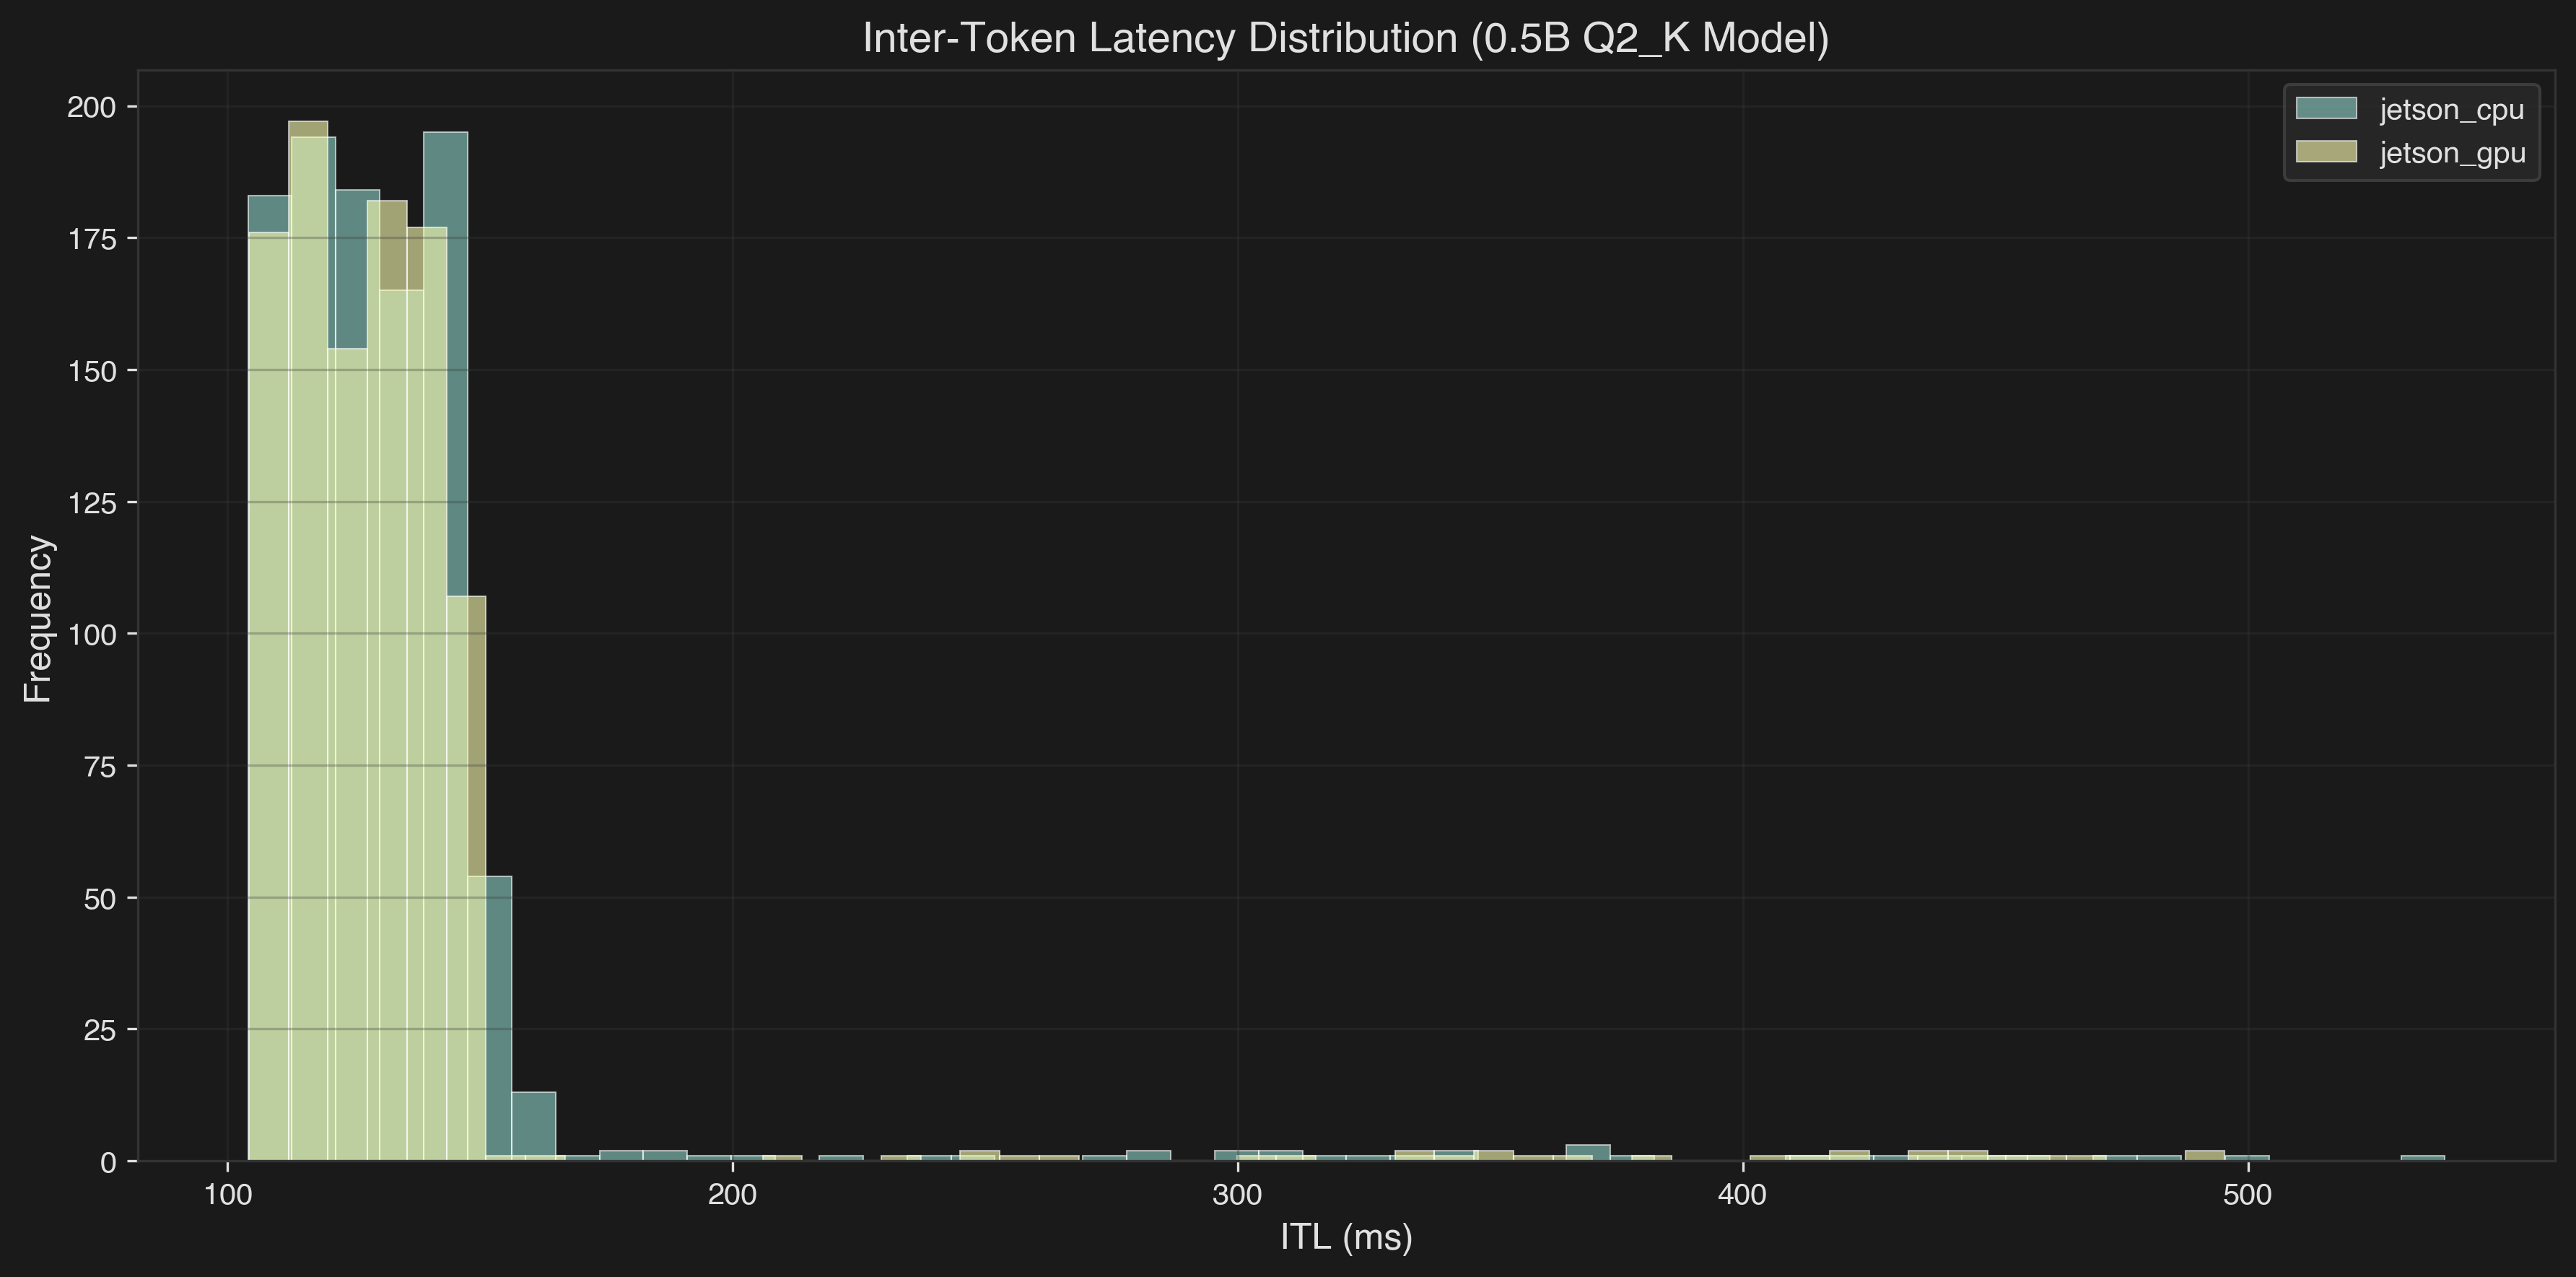
- Jetson CPU and GPU have similar latency profiles for token generation
- Most tokens are generated in 100-150ms range
- Some outliers show occasional performance hiccups
Performance Heatmap #
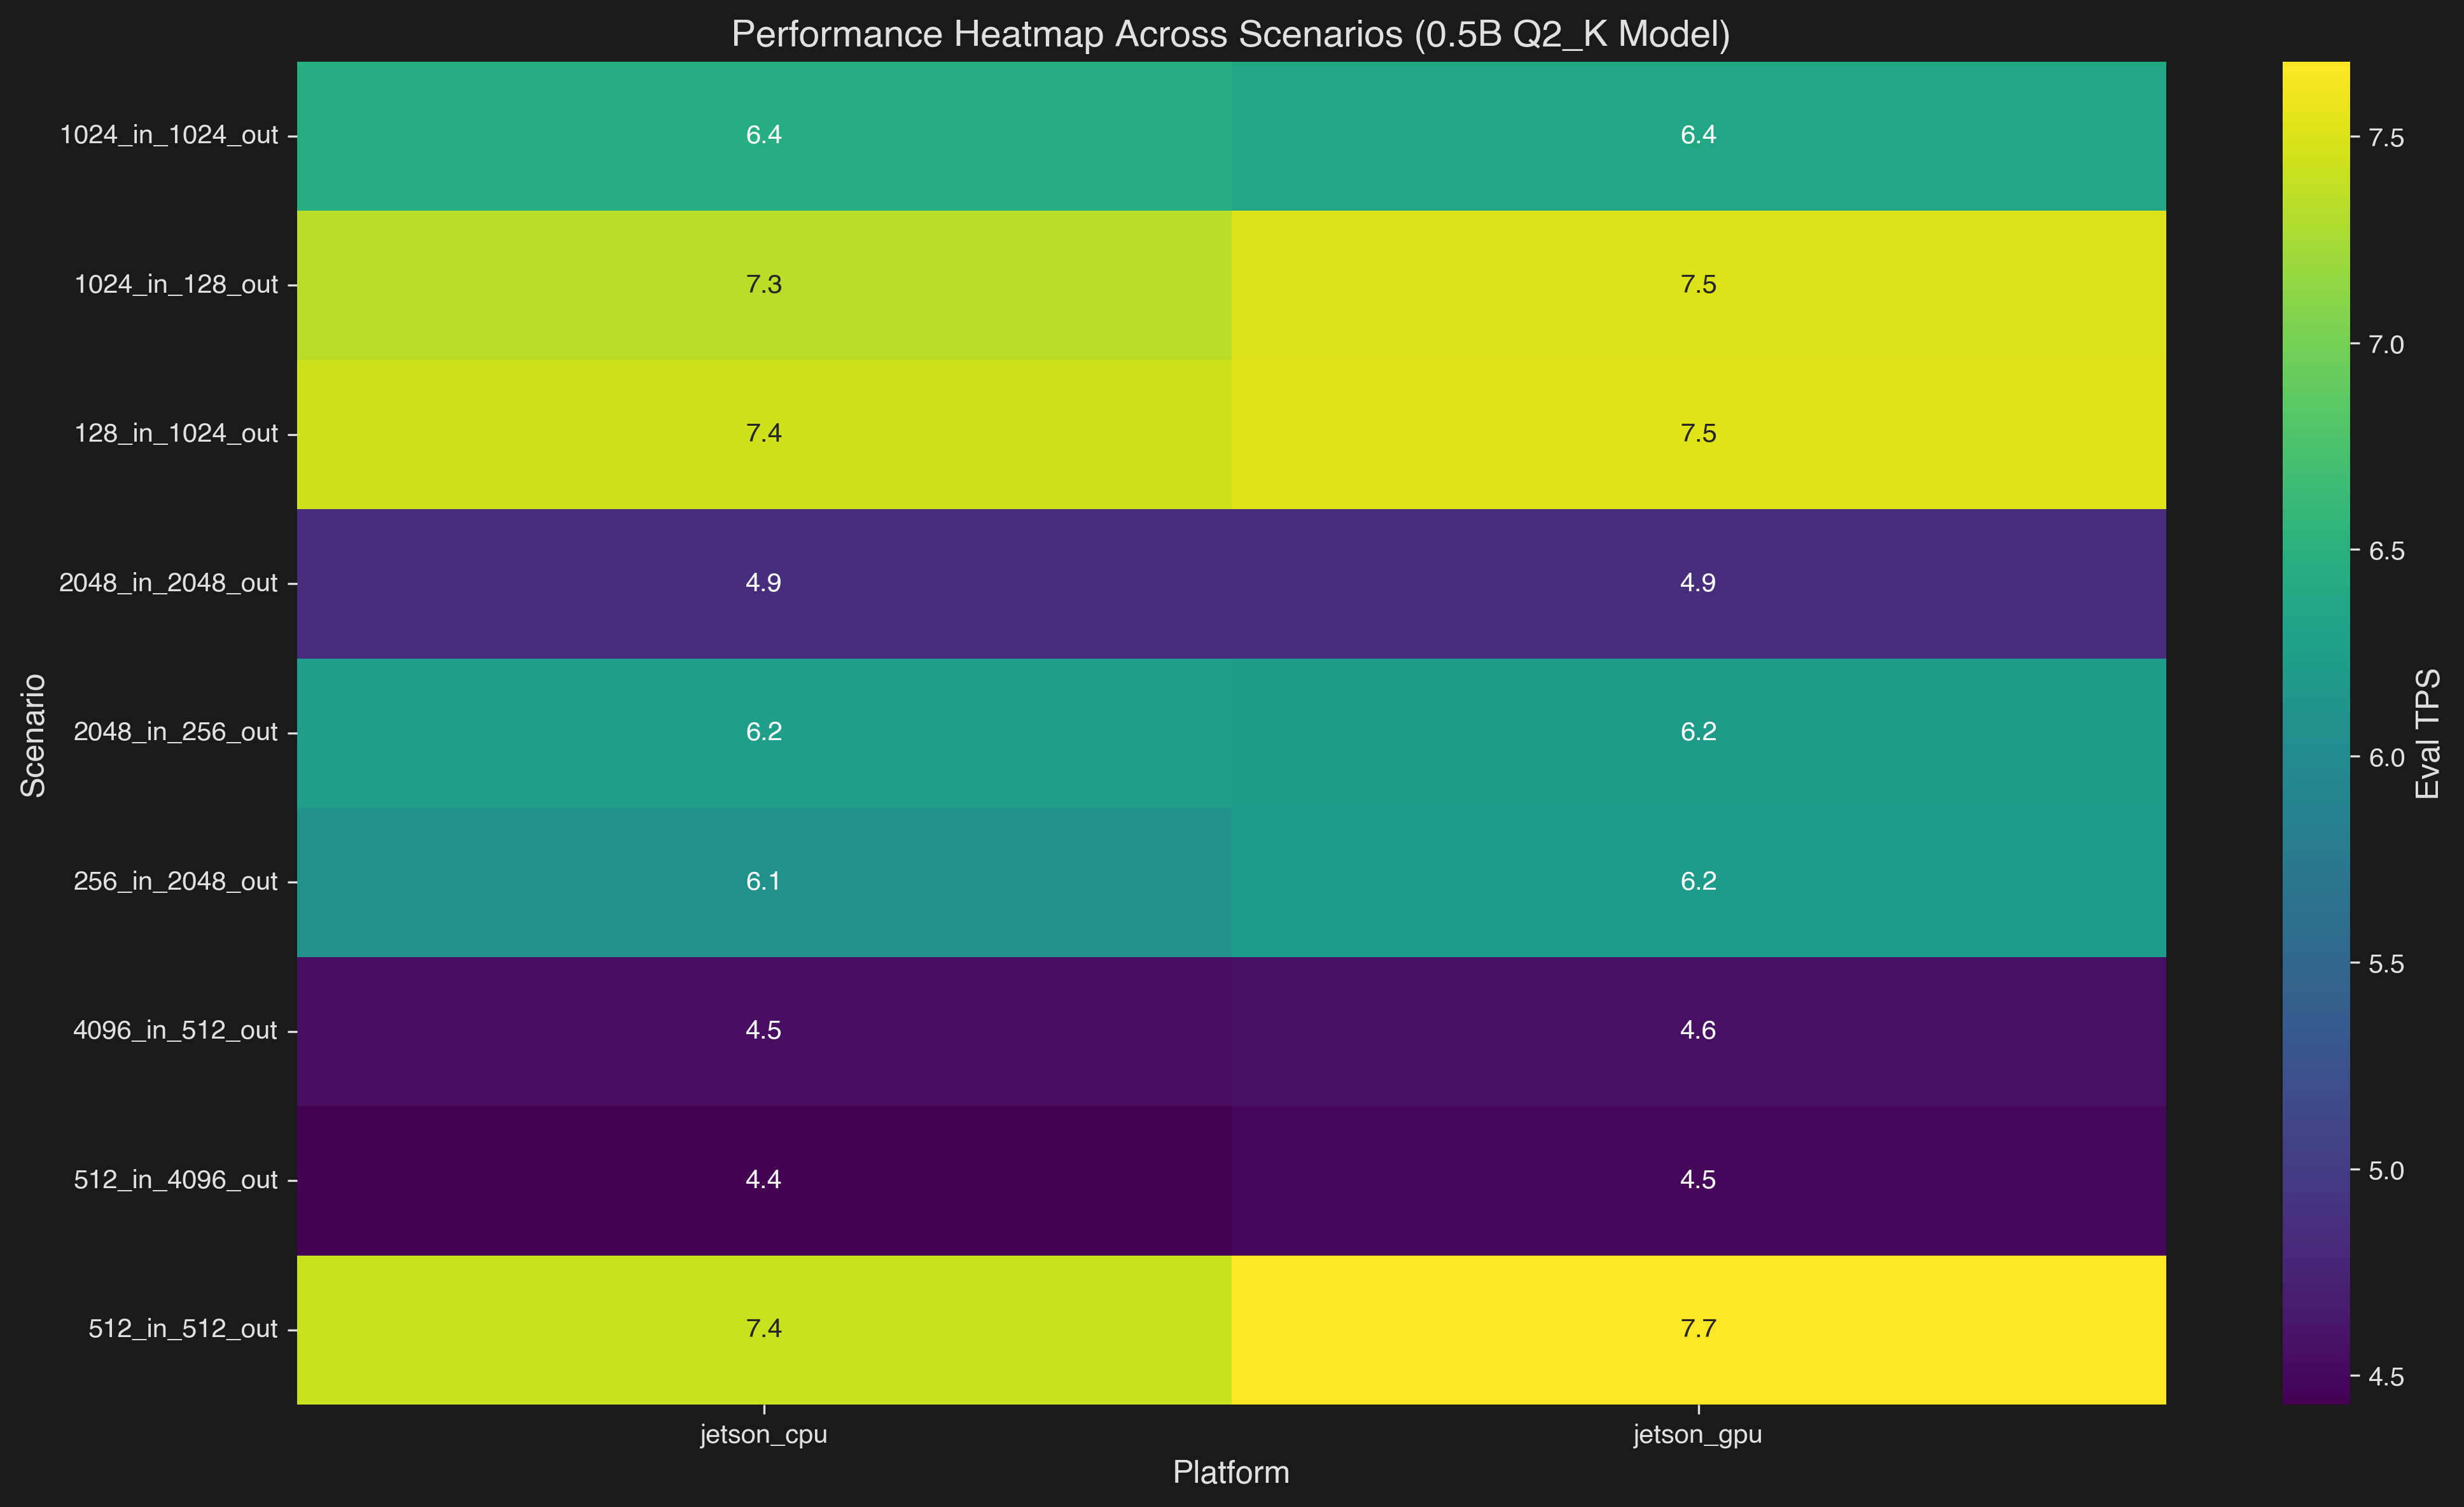
- GPU shows consistent advantages across most scenarios
- Performance varies based on input/output token ratios
- Chat scenarios (128_in_1024_out) show best relative GPU improvements
Thermal Management #
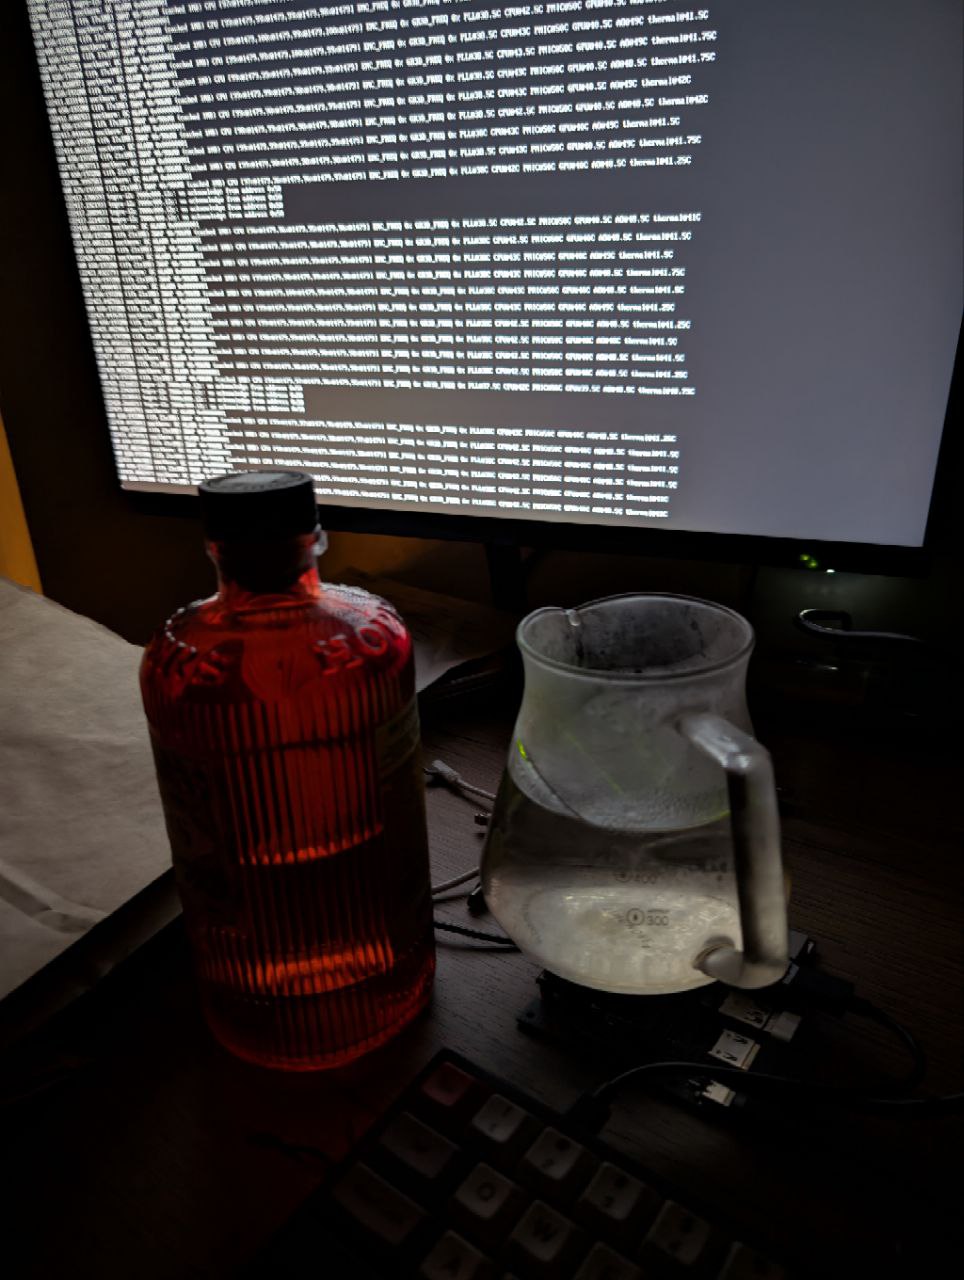
I also got Overcurrent Alarm, maybe because I fed my 10W Jetson with 120W Macbook Pro charger, but I’m not sure, I couldn’t google problem cause.
Conclusion #
Not bad for a $70 board from 2018. Sure, it’s 100x slower than an M3, but it’s running actual LLM inference on a device that’s mostly heatsink and hopes.
Still, it’s only thing with CUDA cores (alas outdated but 5 generations. I mean, Ada Lovelace has 128 CUDA cores are included in each SM) I own and have direct access.
I’ve just started digging deeper into CUDA, so expect more posts soon.
I spent four days juggling bottles to get these numbers.
Literally.
Because of that, producing good plots was harder than producing the data itself. I wasn’t entirely sure what to visualize, what comparisons would be meaningful, or which metrics deserved the spotlight. So for now, please rely on the textual results and analysis above. Proper graphs will come later, once I stop using my kitchenware as a thermal management system.
Acknowledgments #
- steelph0enix for llama.cpp guide
- Modal (pls hire me) for LLM’s Engineer Almanac
- pythops for jetson-image and tegratop
- last moment finding Nvidia Jetson AI Lab